May 22, 2023 11:18 am

Creating a Framework for Impact

Today’s schools are measuring success by more than test scores and graduation rates. That’s why Imagine Learning built an Impact Framework: to collaboratively set goals and chart student progress as partners in success.

There are as many ways to make an impact in education as there are students in school. By ‘zooming out’ from only measuring impact the traditional ways – retention, test scores, graduation rates – educators can explore how comprehensive their impact is and could be.

Some days, seeing a student show empathy toward another classmate is evidence of a well-implemented social and emotional learning program. On other days, you can hear the impact of comprehension lessons as you listen to a small group literature discussion. A school’s growth can look like: more languages being heard on campus, math and science bowl awards in the trophy case, connecting courses to career paths, and the student-led pursuit of ‘what’s next.’

The success of a school or district’s impact is often all in how it’s measured.

How can we help?

More educators – from the classroom teacher to the superintendent – are adding metrics like student agency and engagement to how they track positive impact. With that in mind, Imagine Learning set out to determine how we could help chart success as we work closely with them.

Elizabeth Lehnertz, Vice President of Marketing, explains: “We really want to work in partnership with our customers to set a growth trajectory. Growth is the ultimate outcome for our products, but the road to get there isn’t something that happens overnight. That’s why we’ve been thinking about the metrics that lead up to growth.”

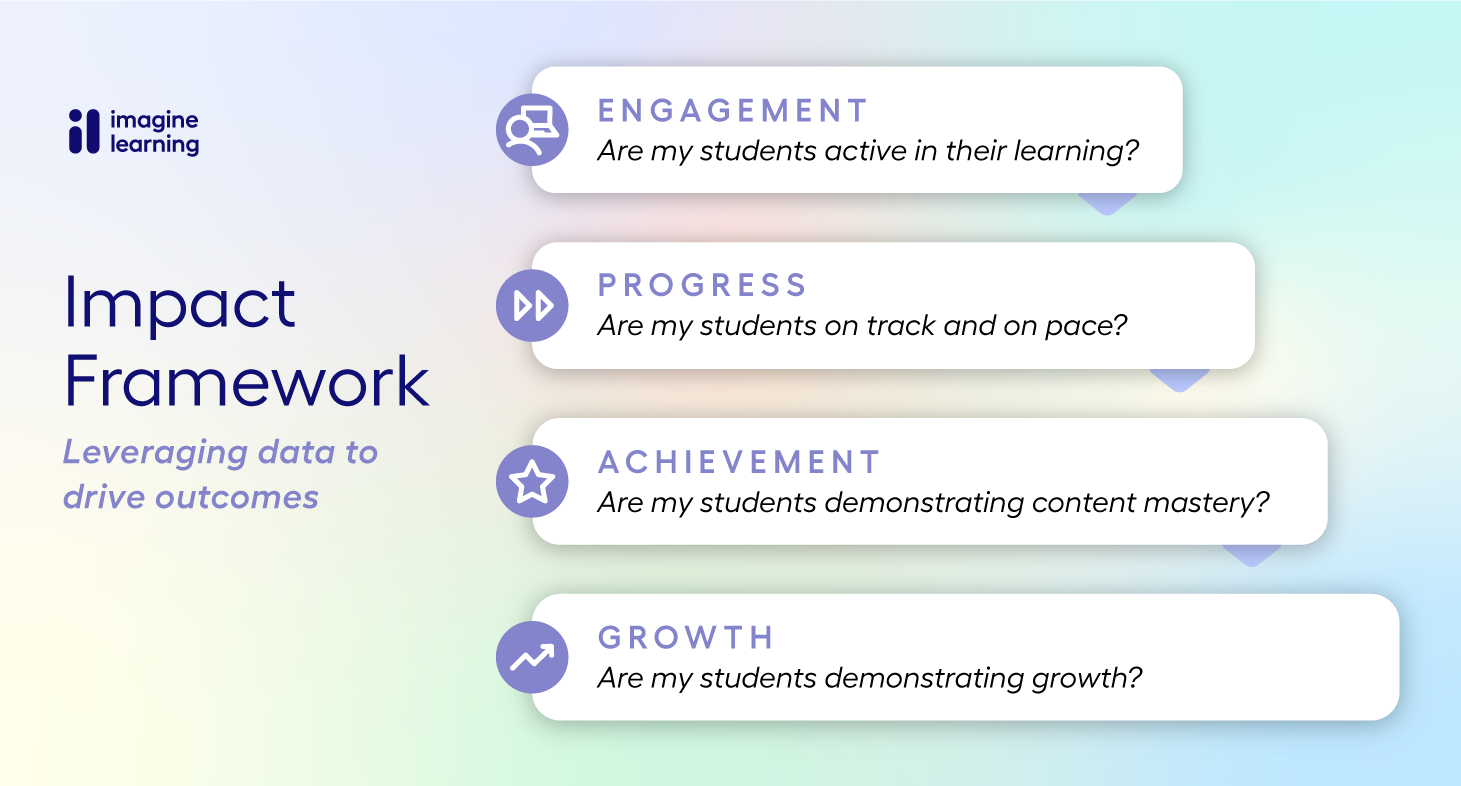
After discussion and consideration, the Imagine Learning team identified the metrics of its Impact Framework, as well as questions to consider and examples at each step:

  • Engagement
  • Progress
  • Achievement
  • Growth

Each metric builds on the one before it, so setting goals according to each one provides a strategic road map to growth. Lehnertz states, “The use of these performative metrics can vary by the [Imagine Learning] product you’re using and by the year of implementation, which is why we’re interested in working collaboratively with our customers to set goals that will drive growth.” 

“Each metric builds on the one before it, so setting goals according to each one provides a strategic road map to growth.”

Are students engaged?

It all starts with engagement. Students who aren’t engaged are significantly less likely to achieve the measurements of success outlined by their school and district. For Imagine Learning, questions around student engagement include ‘Are administrators monitoring and encouraging program use?’ ‘When are students actively working?’ ‘Are the students spending enough time in the program?’

Assessing things like logins, active time, the number of student users, and students’ use of motivation features helps measure engagement and inform the next steps in the educator/Imagine Learning partnership.

Are students progressing?

Determining student progress requires assessing the number of activities and lessons completed and checking students’ pacing and grade level progression. It also means asking if teachers ensure students have content to work on and examining how teachers monitor progress. By considering these questions, we can target areas of the program’s implementation that need more connection between our customer success team and partners. When we can ensure teachers are able to use the program at its fullest capacity, everyone is better positioned for progress.

Are students achieving?

This is where scores take their turn as key examples of a metric:

  • Grades
  • Activity Score
  • Lesson Score
  • Quiz Score
  • Pass Rate

When focusing on student achievement, we examine whether students are mastering the content and where they struggle. Looking at whether teachers are providing challenges or support based on individual and small group needs also helps. The more in-depth our understanding of teachers’ and students’ experiences, the better we can provide support and develop programs that equip customers for success.

Are students growing?

Finally, the big question. Pulling insight from what we learn about students’ engagement, progress, and achievement, we look at demonstrations of growth on benchmarks and pre- and post-quiz growth. We also explore how our partners’ students’ growth compares to the expected growth rate to determine our programs’ impact.

Imagine Learning Impact Framework

Look back to look forward

Thanks to the Impact Framework functioning as a roadmap, we can look back through the metrics to troubleshoot any development gaps and generate solutions. As Lehnertz explains: “We’ve identified these metrics – engagement, progress, achievement – as ways to lead to growth. We’ve been looking across our products and across the stages of implementation to really work with our customers to identify goals for each. We then use those goals as a formative way to adjust the implementation and the approach, ultimately leading to growth.”

Combined with the often-immeasurable, personal impacts educators are making every day, the potential is nothing short of exciting. 

Elizabeth Lehnertz

Elizabeth Lehnertz

Vice President, Marketing

Elizabeth brings over 25 years of experience in education, first as a classroom teacher in Texas before moving into educational publishing and technology. She has held leadership roles in product marketing, product management, and corporate marketing at Pearson, Renaissance Learning, and McGraw-Hill.

With the passion to improve education for teachers, students, and families alike, Elizabeth brings the insight and experience to build and lead industry-leading teams to solve complex problems in a dynamic market.

About the Author — Kallie Markle

Kallie Markle lives in Northern California with her family of humans, house plants, and dogs. The humans take up the least amount of space. Before joining the education world, she wrote her way through national parks, concerts, tourism, and brewing.